
EDUCATION
1 Dropout Every 26 Seconds!
10 Jaw-Dropping Awesome Infographics on Education
How Infographics Accelerate Learning
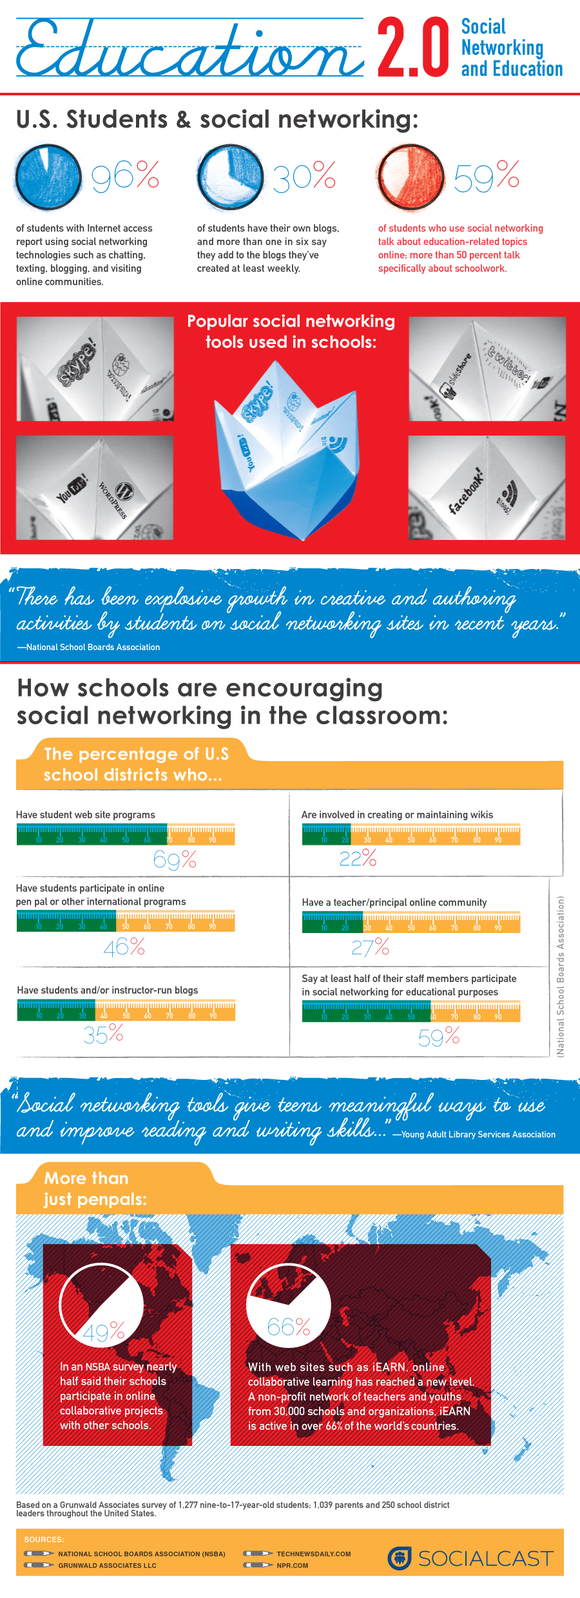
How to Get Better Grades Using Social Media
How Stress Can Hurt Your Test Scores
How to Get Better Grades Using Social Media
How Stress Can Hurt Your Test Scores
Teaching With Infographics: Places to Start- from the New York Times; examples shared over five days. Includes a section on the page entitled "Places to Start Learning About Infographics."
HEALTH
17 Educational Infographics to Learn About Reproductive Health-includes Teen Pregnancy in America, Abortion State-By-State, STDs in America and Porn and the Economy.
The Addiction Process: How We Get Addicted
Amazing Facts About the Human Body
17 Educational Infographics to Learn About Reproductive Health-includes Teen Pregnancy in America, Abortion State-By-State, STDs in America and Porn and the Economy.
The Addiction Process: How We Get Addicted
Amazing Facts About the Human Body
Carrots Used to Be Purple?
The Changing Face of A.I.D.S.
Chemicals in Cigarette Smoke
Drug Use in Today's Classroom
The Embarrassing Lack of Clean Water Access in the World
The Facts About Heart Disease
The Changing Face of A.I.D.S.
Chemicals in Cigarette Smoke
Drug Use in Today's Classroom
The Embarrassing Lack of Clean Water Access in the World
The Facts About Heart Disease
How Healthy is Your City, State or Country?- topics covered include obesity, environmental issues, diseases and addictions and other issues.
How Soft Drinks Impact Your Health
Lung Cancer Facts
How Soft Drinks Impact Your Health
Lung Cancer Facts
HISTORY / SOCUAL STUDIES / GEOGRAPHY / CURRENT EVENTSThe 10-Minute Guide to the U.S. Constitution
10 of the Web's Most Insightful News Infographics
10 of the Web's Most Insightful News Infographics
Flowing Data-collection includes the Kennedy family tree, Evolution of the Two-Party Vote During the Past Century and What Generation Do You Belong To?
Simple Complexity- samples include Misleading Statistics, Berlin Wall, and Government Expenses Worldwide by GDP.
What Does Your State Do Worst?- from crime to pollution each state is labeled in this infographic
Where in the World Are Exiled Leaders?
Where in the World Are Exiled Leaders?
LANGUAGE ARTS
10 Commonly Misunderstood Words in English
A Literary Map of Manhattan- cool interactive infographic
Spell Check
Storytelling Isn't Just for Campfires
Troublesome Words
Verbs with Prepositions
10 Commonly Misunderstood Words in English
A Literary Map of Manhattan- cool interactive infographic
Spell Check
Storytelling Isn't Just for Campfires
Troublesome Words
Verbs with Prepositions
17 Things You Didn't Know About the Brain
2010's Most Threatened Animal Species
Anatomy of a Hurricane
2010's Most Threatened Animal Species
Anatomy of a Hurricane
How We Use Our Brains
Language and Your Brain
Missions to Mars
The Most Dangerous Species in the Mediterranean
Renewable Energy Sources
Language and Your Brain
Missions to Mars
The Most Dangerous Species in the Mediterranean
Renewable Energy Sources
